Salesforce Debugging Made Easy: A Deep Dive into Apex Log Analysis

We all want to build new things instead of fixing old things but if you’re a Salesforce developer, you would have most likely been tasked with troubleshooting an issue before (and probably more frequently than you would like). In that situation, you have two options:
- You wait and hope the issue somehow magically resolves by itself or
- You can actually start troubleshooting the issue by going through the Apex logs.
Since the former is very unlikely to happen, It is always suggested to go with the latter!
To start, what are Apex logs? Apex logs in Salesforce are a rich source of information with regards to a database transaction in Salesforce. They record a variety of activities such as:

- Database operations
- System processes
- Apex code flow
- Declarative process flows
- Backend validations
- Callout information
- Limits consumption
- And much more.
So now that all the required information is gathered in one place, we should be able to simply dive into the logs and quickly narrow down the root of the issue right? Well, it’s not that easy. Debug logs typically contain thousands or tens of thousands of lines with all sorts of information and attempting to consume them in their raw format would definitely burn some mental calories before you can wrap your head around them and pin down the issue. This is where the Apex Log Analyzer tool comes in handy. In this post, we will discuss how to utilize the tool to help us parse all the data in Apex logs more efficiently.
Let’s imagine that one of the test methods in a test class is failing with an unexpected error or end users are reporting a process is not working properly or they are seeing a weird error on their screen.
We would start by enabling debug logs and re-produce the issue which would generate an Apex debug log. We can then open or download the log and start trying to make sense of it. Some issues could be pretty straightforward which makes it possible to parse the debug log manually and find the cause of the issue. But in case of complex processes and errors, especially the ones which occur due to exceeded governor limits like “Too many SOQL queries:101”, “Too many DML statements:151”, “Apex CPU time limit exceeded”, etc, the issue could be due to a single process or a combination of multiple process executions within the course of a single transaction.
Perhaps a certain method was not written according to best practices and a query or a DML statement are written in a for loop or certain blocks of code are being redundantly invoked multiple times. In these scenarios, it becomes extremely difficult to identify the root cause by manually parsing through all the information in the debug logs.
A solution would be to use the Apex Log Analyzer tool, which is available as a Visual Studio Code extension. The tool consumes an Apex log file in its raw format, processes it, and displays the log data in a graphical format, a tree format, a report, and also gives an overall summary of the database operations.
Open VSCode, navigate to Extensions and search for Apex Log Analyzer. Install the extension provided by Certina. Navigate to the downloaded log file, right click on it, Open with VSCode. Once opened in VSCode, right click on the file. If the extension is installed, you will find an option “Log: Show Apex Log Analysis”. Click on it and the details are generated instantly by the tool.
Apex Log Analyzer was built by Certina, and it has been made available as a VS Code extension. At the top, the tool displays the log summary with the log name, total size, total execution time, list of exceptions if any, and a summary of the log levels.

Timeline:
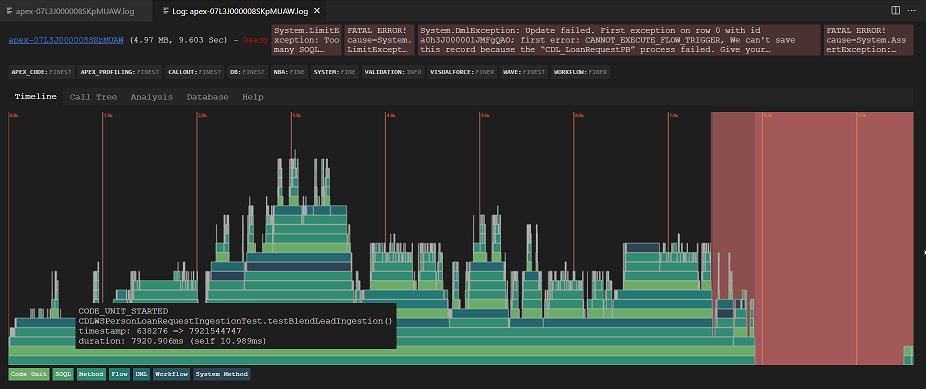
As they say, a picture is worth a thousand words. If you’ve ever read through an Apex debug log, I’m sure you would agree that trying to mentally map the call tree is not a walk in the park. This tool makes it less taxing on you by providing a timeline view of the nested calls and duration of each method or statement, plus it untangles the responsibilities of managed packages and flows in the overall execution. Time runs left-to-right and nested calls run bottom-to-top. This gives you quick visual clues to zero in on potential trouble areas which is a great timesaver when troubleshooting an issue.

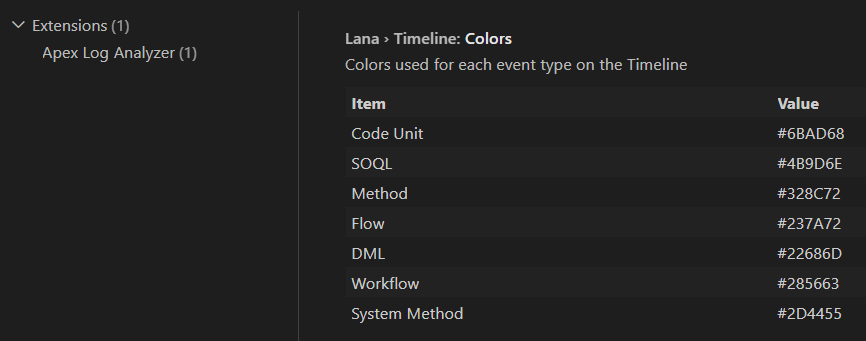
Information about nodes on the graph is shown as a tooltip when hovering the mouse over a node. Clicking on a timeline node will take you to the entry in the “Call Tree”. The timeline can be zoomed in and out by scrolling up and down on the mouse. Click the mouse down and drag to move the timeline around both in the x and y direction, when zoomed. A color key at the bottom of the graph shows the mapping between the colors and call types. This mapping can be configured in Extension Settings.

Call Tree:
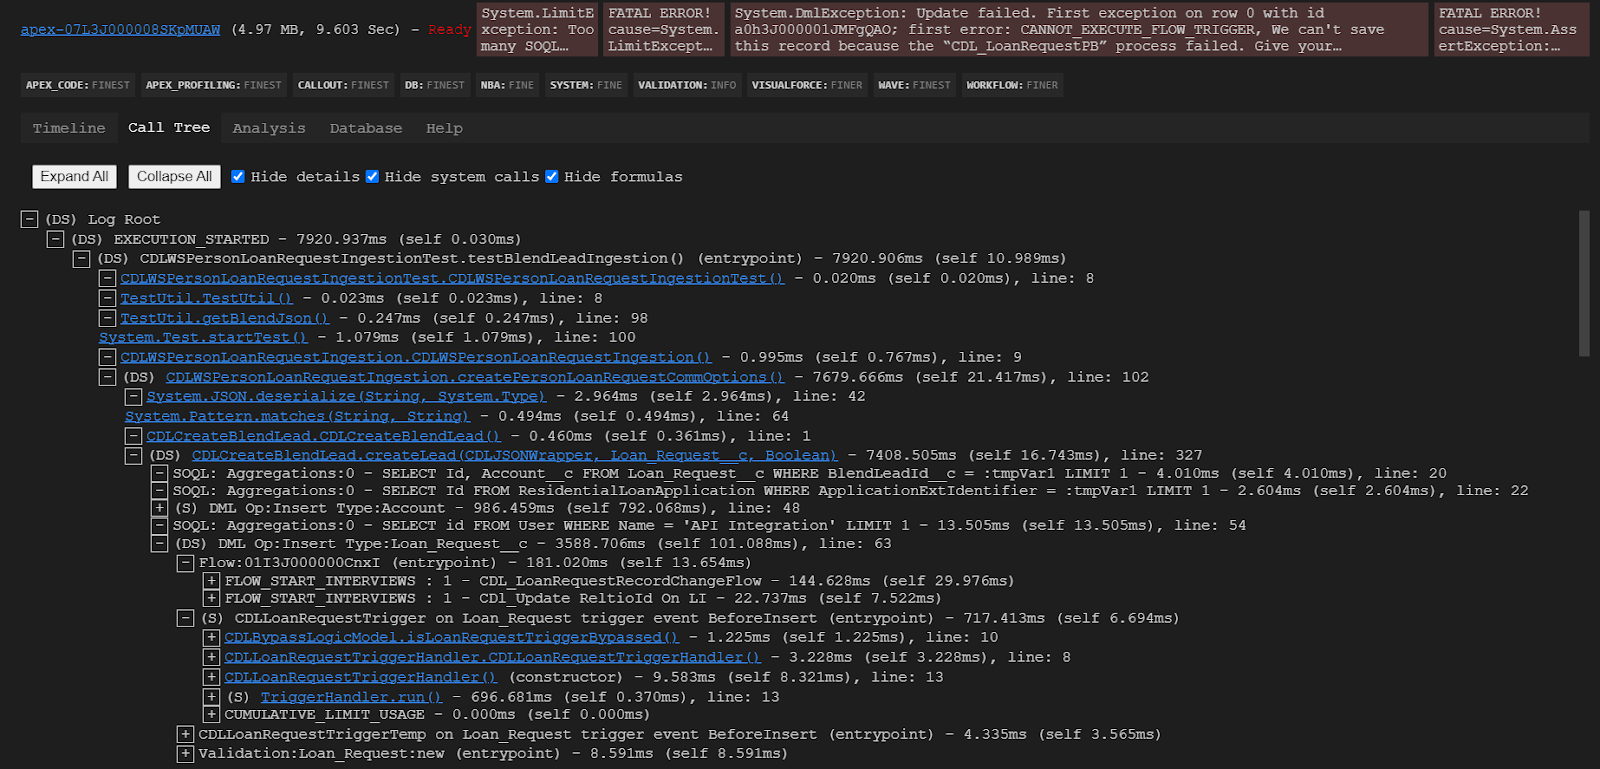
This tab displays the log information in a tree structure. It starts with the root and drills down to all the child invocations. This is very helpful as it provides us with clear information regarding the flow of code and order of execution with respect to functionality within a transaction. The execution time for each process is also displayed.

The tree can be expanded/collapsed with the “+/-” buttons on each method or with the “Expand All” / “Collapse All” buttons in the toolbar. To show other information (e.g. SOQL statements or variable assignments) in the tree, un-tick the “Hide details” checkbox.
There are also filter checkboxes to “Hide system calls”, “Hide formulas” and “Hide under” a given duration. The prefix ‘(S)’ is used to indicate callers of methods which perform SOQL and ‘(D)’ is used to indicate callers of methods that perform DML.
The individual methods are displayed as a link and clicking the link takes you to the source code in your project, provided you have that source locally.
Analysis:
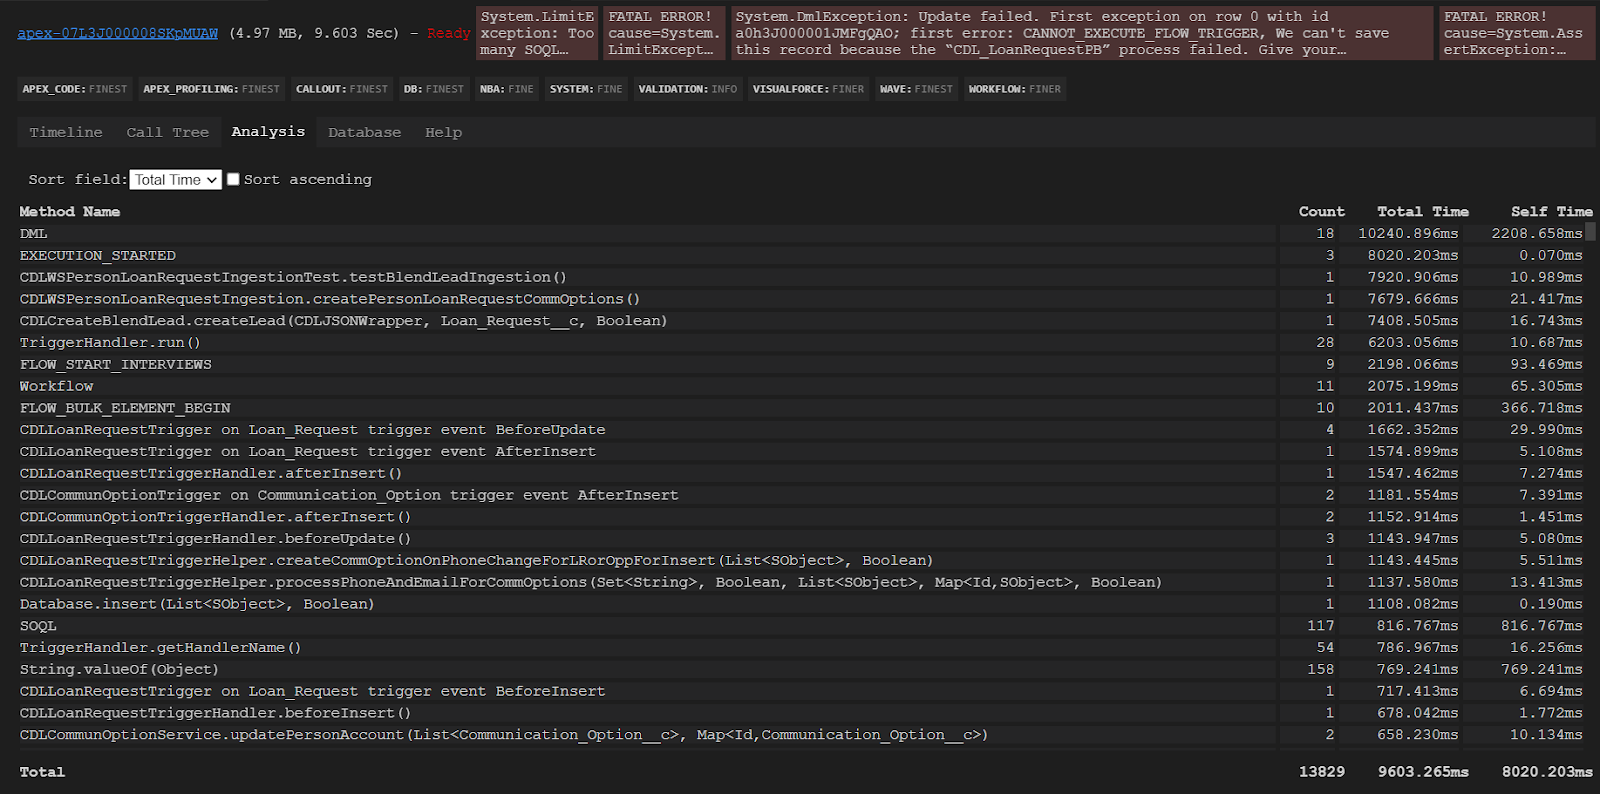
This tab displays an aggregated summary of method performance, showing you the method name, time taken for method self-invocation, total time taken by the method, all its child invocations, and the number of times each is called.

The data can be sorted by all these attributes. When identifying opportunities for performance optimization, sort the methods with high execution times and call counts.
Database :
This tab gives you an aggregated breakdown of the total number of DMLs and SOQL queries contained in the log and the total number of rows returned in each. It also shows every SOQL query executed in the transaction, the method from which it was executed, and the number of times each of the SOQLs were executed.

This is helpful with identifying the cause of SOQL 101 and DML 151 exceptions. We can also monitor the rows returned with each SOQL so we can determine whether any query optimization is required.
By transforming complex, voluminous Apex logs into clear, visual representations and integrating Apex Log Analyser into your development toolkit will significantly boost your debugging efficiency. This tool allows developers to more quickly and efficiently resolve performance bottlenecks and mistakes, facilitating quicker resolution times.
When combined with ApexGuru Insights—as discussed in our earlier blog post, "Apex Meets AI: The Future of Salesforce Development Is Now!"—these tools provide a far more efficient approach to Salesforce development. With AI/ML driven insights and prescriptive code recommendations, ApexGuru automates the discovery of critical anti-patterns and performance hotspots in your Apex code. By applying both Apex Log Analyser and ApexGuru, it becomes possible to facilitate developers in not only identifying and revealing problems in their code but also get intelligent recommendations for maximising the efficacy of the code and the overall results.
This synergy between Apex Log Analyser and ApexGuru simplifies development, reduces troubleshooting time, and boosts the overall scalability and quality of your Salesforce systems. By utilising these innovative instruments developers can focus on actually developing more innovative ideas than getting caught up in debugging problems.
Ready to take your Salesforce performance to the next level? Let’s talk. Contact Cloud Peritus today and discover how we can supercharge your org with AI-powered efficiency!
Contact us at info@cloudperitus.com
Cloud Peritus has been at the forefront of innovation since its inception and has since played an integral role in delivering game changing solutions to its clients time and again, resulting in 5 star reviews from across the board.
Feel free to check us out at Salesforce AppExchange.
